Nvidia Earnings This Week - Strong Free Cash Flow and FCF Margins Could Push NVDA Higher
/NVIDIA%20Corp%20logo%20outside%20building-by%20BING-JHEN_HONG%20via%20iStock.jpg)
Nvidia Inc. (NVDA) could surprise analysts and the market if its gross and free cash flow (FCF) margins come in stronger than expected. Nvidia will release its fiscal Q1 2026 results for the quarter ended April 30 after the market closes on Wednesday, May 28.
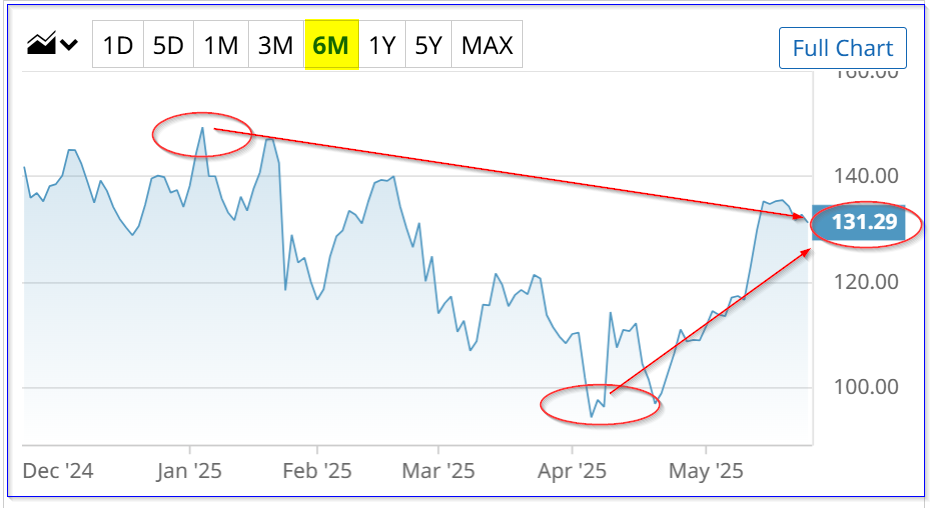
NVDA closed at $131.29 on Friday, May 23. NVDA has been treading water, waiting for these results. It is up from April lows, but off January ($149.43 on Jan. 6) and February peak prices. All eyes are now on how Nvidia performed and management's guidance for the year.
NVDA stock could be worth $159.20 per share (see my May 20 Barchart article, and a May 13 Barchart article, "Unusual Activity in Nvidia Put Options Ahead of Earnings - Are Investors Still Bullish?).
What to Expect
Revenue. Moreover, in the last two weeks, analysts have upgraded their revenue forecasts. For example, Seeking Alpha now reports that the average analyst expects $43.20 billion in revenue for fiscal Q1 2026.
That is up from $43.05 billion I reported in the May 13 Barchart article discussing analysts' forecasts.
Last quarter, management guided for a forecast of $43.0 billion, plus or minus 2.0% (i.e., $42.14 billion to $43.86 billion). Given that analysts are still below management's upper guidance, any figure above $43.2 billion should be a boon for NVDA stock.
Gross Margins. Similarly, with management's gross margin (GM) forecasts, there could be room for an upward surprise. Last quarter, management projected a GM of between 70.6% and 71.0%. But that was much lower than fiscal Q4's GM of 73.5%.
Moreover, in Q1 2025, a year ago, the GM was much higher at 78.4%. As a result, any result from Nvidia with gross margins above 71.0%, as management's upward guidance expects, as well as close to Q4's 73.5%, should be positive for NVDA.
Free Cash Flow. Lastly, about free cash flow (FCF) and FCF margins, last quarter, Nvidia generated $15.19 billion in FCF from $39.33 billion in revenue. That works out to a 39.5% FCF margin. Here is how that compares to prior periods - see the table I put together below:

It shows that although free cash flow has been rising (except for Q4 2025 ending Jan. 2025), its FCF margins have been falling (i.e., from a peak of 57% to less than 40%).
This is clearly due to higher capex spending as Nvidia builds out its AI-related semiconductor chip design ability. For example, for the quarter ending Jan 2025, Nvidia spent over $1.1 billion on capex. That represented 2.79% of sales
That was higher than the Oct. 2024 quarter capex spend of $842 million (2.4% of sales) in the Oct quarter and just $409 million in the April 2024 quarter (just 1.85% of sales).
So, if Nvidia spends more than 2.79% on capex in the April quarter, that could explain why its FCF margins may not equal last quarter's 39.5% FCF margin.
Target Prices for NVDA Stock
For forecast purposes, let's assume that the company makes a 39.5% FCF margin going forward.
So, using analysts' estimates for revenue (see above), we can project its FCF for the fiscal year ending Jan. 2026:
$43.2 billion (est. for FY Q1 2026) x 4 = $172.8 billion run rate revenue x 39.5% = $68.3 billion FCF
However, analysts are expecting quarterly growth in revenue. For example, Seeking Alpha's and Yahoo! Finance's survey of 58 analysts shows a forecast of $199.39 billion. In other words, they expect a compound annual growth rate (CAGR) of +15.38% over the next 4 quarters (i.e., $199.39b/$172.8b).
So, using this higher revenue estimate, FCF could rise to $78.8 billion:
$199.39 billion FY 2026 revenue est. x 39.5% FCF margin = $78.76 billion FCF
That means, using a 2.0% FCF yield metric (which is the same as multiplying FCF by 50x), its market cap could be worth over $3.9 trillion:
$78.76 billion / 0.02 = $3,938 billion market cap
That is 23% higher than the stock's existing market cap of $3.2 trillion, according to Yahoo! Finance. In other words, NVDA stock is worth 23% more than its closing price of $131.29:
1.23 x $131.29 = $161.48 per share
This is very close to Yahoo! Finance's survey of 62 analysts, with an average price target of $162.77 per share. (My analysis shows you how they arrive at their price targets).
Similarly, Barchart's mean survey shows a target of $167.00.
AnaChart.com, which tracks analysts who have recently written on NVDA stock, shows that 40 analysts have an average price target of $169.78. Once Nvidia releases its results (after several days), AnaChart will have a revised price target average that we can review.
Summary
Analysts will be looking to see if revenue exceeds management's target range and if gross margins are higher than expected. Moreover, if its FCF margin is equal to or exceeds 39.5%, as last quarter, the stock could be worth significantly more.
In addition, if analysts raise their revenue forecasts, even if FCF margins are lower, this could still lead to a higher target price.
The bottom line is that Nvidia's FCF and FCF margins could lead to a higher stock price target and potentially a higher price for NVDA.
On the date of publication, Mark R. Hake, CFA did not have (either directly or indirectly) positions in any of the securities mentioned in this article. All information and data in this article is solely for informational purposes. For more information please view the Barchart Disclosure Policy here.